BTC practical playbook: Gamma Exposure
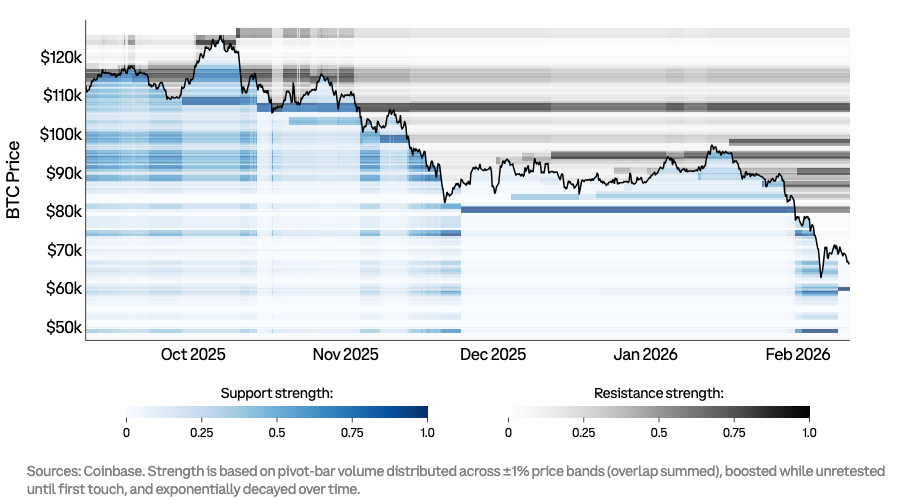
We shared a report this month introducing a custom heatmap from our BTC Playbook that quantified real supply and demand levels for bitcoin. As a quick recap, we aggregated key pivot points in market structure and volume into price bands to identify levels that repeatedly acted like support (blue) or resistance (grey) (Chart 1). These levels act as an indicator of where market interest has been established and where significant pools of resting liquidity typically gather. Based on the latest price action, the densest support cluster sits near $60k, while the first dense resistance band sits around $82k.
Chart 1. BTC support and resistance key levels
This week, we add an additional layer of insight to the key levels: gamma exposure. Gamma exposure turns the options market into a “hidden liquidity provider” that can either dampen price swings or amplify them, so it helps investors choose between range trades (buying support/selling resistance) and breakout trades (entering at levels that anticipate a new trend).
Gamma exposure (GEX) is a way to summarize how options dealers (the intermediaries who quote and warehouse option risk) must hedge themselves when BTC moves. Effectively, GEX summarizes the behavior of dominant hedgers when prices shift: do they push back against the move or add fuel to it? When gamma exposure is large, hedging flows become mechanically important and can shape short-run market structure (i.e. the characteristics that affect market pricing).
First, what is gamma? Gamma is one of the key options metrics (the “Greeks”) that measures how quickly an option’s price sensitivity changes when the token price moves. Typically, a dealer is long gamma when they have bought more options than they have sold and short gamma when the reverse is true (though strike prices and expiry dates also factor in very heavily here). When a dealer is long gamma and the price of BTC rises, they may need to sell BTC to hedge their exposure. When BTC falls, they may need to buy BTC to offset their exposure.
In other words, high positive gamma usually means the market self-stabilizes near those strikes because hedgers tend to buy dips and sell rips. In positive gamma regions, the dominant hedging behavior often looks like a shock absorber because if BTC rises, dealers sell spot (or sell futures) to stay hedged. If BTC falls, they buy to rebalance. That “sell strength / buy weakness” pattern reduces realized volatility and increases the odds of consolidation and “pinning” around nearby strike clusters, especially as large expiries approach. For positioning, positive gamma generally favors strategies that monetize mean reversion and lower realized volatility.
High negative gamma usually means the market destabilizes because hedgers tend to buy as price rises and sell as price falls. In negative gamma regions, the dominant hedging behavior can flip into a trend amplifier. Rising BTC prices force hedgers to buy more while falling prices force hedgers to sell more. That “buy strength / sell weakness” loop can turn ordinary breaks into fast repricing and liquidation-style cascades. For positioning, negative gamma raises the value of convexity and reduces the reliability of buying support or shorting resistance on a first retest.
Chart 2. BTC options gamma exposure (GEX)
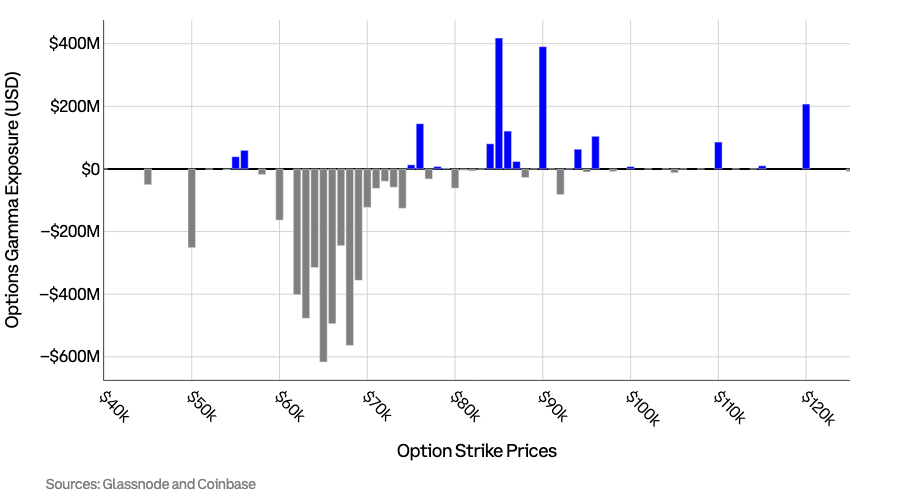
Combining the key pivot levels with GEX, we get the following: $82k remains the first gate to unlock further upside, while $60k appears to be the shelf that must hold to prevent accelerated downside. This is a consequence of the gamma profile showing a pronounced negative gamma band concentrated in the $60–70k region and meaningful positive gamma pockets higher up at $85K and $90k. That pairing implies two regime tendencies: downside into $60k can accelerate, while upside into $90k can grind and pin.
Consequently, we isolate the following scenarios and how to play them:
-
If BTC rejects at $82k and mean reversion dominates: If BTC approaches $82k and fails to hold above it, then the key pivot levels suggest strong resistance, and the gamma picture does not provide a strong stabilizing pocket. In that regime, breakout chasers tend to get trapped, while tactical sellers get cleaner invalidation. Thus, the higher-probability expression is defined-risk bearish exposure through option structures like a bear put spread. We prefer defined-risk structures here because conviction is often moderate (particularly without a clear macro catalyst): resistance can break, but first-touch rejection remains common at dense supply zones.
-
If BTC breaches above $82k and upside becomes more probable: Acceptance of the $82k level means BTC reclaims the level, holds it, and begins using it as support. When that happens, excess supply at $82k has likely been absorbed, increasing the probability of continuation into the next liquidity bands above. However, the gamma profile shows larger positive gamma from $85k to $90k, which increases chop risk. In this scenario with uncertain flows and unclear upcoming catalysts, we think a call spread may dominate outright calls because it keeps convexity while reducing theta bleed in a grind.
-
If BTC tags ~$60k, flushes, and then reclaims: Here, we think it makes more sense to buy after the reclaim, rather than try to catch the falling knife – expressing upside with an asymmetric payoff. The $60k area is the thickest nearby support zone, so it is the most likely place for a meaningful bounce if it holds. But negative gamma implies the path to that hold can be violent and prone to overshooting. Consequently, we prefer long exposure only after reclaiming signals rather than during the initial selloff. For expression, we think call spreads would deliver better risk-adjusted exposure in a volatile environment.
-
If BTC loses $60k and fails to reclaim: This could reflect another regime break. If the most-established nearby demand zone falters coupled with negative gamma, then the move can extend faster than discretionary dip buyers may expect. If you are risk-managing a long portfolio, then protective put spreads could be useful to hedge downside risk. If you are trading directionally, utilizing bear put spreads over outright shorting can reduce liquidation risk, especially since bitcoin is already trading at depressed levels.
Get early access to insights like these from our research team’s Market Commentary on a weekly basis by subscribing to Coinbase One (if you haven’t already):
https://www.coinbase.com/one?utm_source=twitter&utm_medium=social&utm_campaign=cb1_o_m_w_m_acq_twi_soc_ins_wmc_report&utm_content=feb13_teaser
For immediate access to the reports Coinbase Research team publishes on a weekly, monthly, and quarterly basis, visit our Research and Insights page: https://www.coinbase.com/institutional/research-insights
Source: https://x.com/coinbaseinsto/status/2026387113986670743